


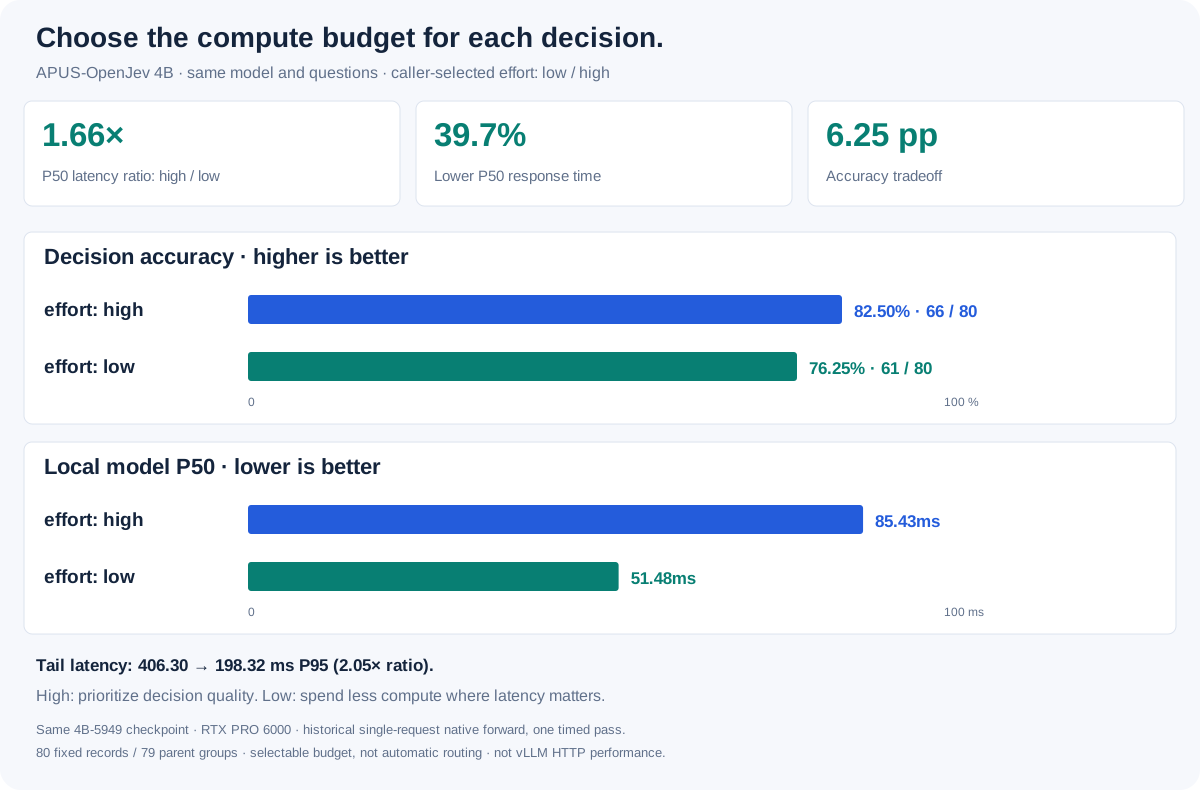


| <svg xmlns="http://www.w3.org/2000/svg" width="1200" height="790" viewBox="0 0 1200 790" role="img" aria-labelledby="title desc"><title id="title">Selectable effort: accuracy and latency tradeoff</title><desc id="desc">Same 4B model, same frozen 80 questions. High accuracy82.50 percent, low76.25 percent. High P50 85.43ms, low51.48ms. 1.66 times P50 latency ratio, 6.25 percentage-point accuracy tradeoff. Caller-selected effort, historical native runtime, not automatic routing or vLLM.</desc><rect width="1200" height="790" rx="20" fill="#f6f8fc"/><g font-family="Arial, Helvetica, sans-serif"><text x="36" y="47" font-size="28" fill="#14243c" font-weight="700">Choose the compute budget for each decision.</text><text x="36" y="78" font-size="16" fill="#60708a" font-weight="400">APUS-OpenJev 4B · same model and questions · caller-selected effort: low / high</text><rect x="24" y="101" width="376" height="105" rx="8" fill="white" stroke="#dce3ee"/><text x="42" y="146" font-size="33" fill="#087f73" font-weight="700">1.66×</text><text x="42" y="181" font-size="15" fill="#60708a" font-weight="400">P50 latency ratio: high / low</text><rect x="416" y="101" width="376" height="105" rx="8" fill="white" stroke="#dce3ee"/><text x="434" y="146" font-size="33" fill="#087f73" font-weight="700">39.7%</text><text x="434" y="181" font-size="15" fill="#60708a" font-weight="400">Lower P50 response time</text><rect x="808" y="101" width="376" height="105" rx="8" fill="white" stroke="#dce3ee"/><text x="826" y="146" font-size="33" fill="#087f73" font-weight="700">6.25 pp</text><text x="826" y="181" font-size="15" fill="#60708a" font-weight="400">Accuracy tradeoff</text><rect x="24" y="232" width="1152" height="192" rx="8" fill="white" stroke="#dce3ee"/><text x="44" y="264" font-size="22" fill="#14243c" font-weight="700">Decision accuracy · higher is better</text><text x="44" y="316" font-size="19" fill="#14243c" font-weight="700">effort: high</text><rect x="248" y="295" width="594.0" height="29" rx="3" fill="#245cdb"/><text x="854.0" y="317" font-size="17" fill="#245cdb" font-weight="700">82.50% · 66 / 80</text><text x="44" y="373" font-size="19" fill="#14243c" font-weight="700">effort: low</text><rect x="248" y="352" width="549.0" height="29" rx="3" fill="#087f73"/><text x="809.0" y="374" font-size="17" fill="#087f73" font-weight="700">76.25% · 61 / 80</text><text x="248" y="406" font-size="12" fill="#60708a" font-weight="400">0</text><text x="944" y="406" font-size="12" fill="#60708a" font-weight="400">100 %</text><rect x="24" y="442" width="1152" height="192" rx="8" fill="white" stroke="#dce3ee"/><text x="44" y="474" font-size="22" fill="#14243c" font-weight="700">Local model P50 · lower is better</text><text x="44" y="526" font-size="19" fill="#14243c" font-weight="700">effort: high</text><rect x="248" y="505" width="615.0662139058113" height="29" rx="3" fill="#245cdb"/><text x="875.0662139058113" y="527" font-size="17" fill="#245cdb" font-weight="700">85.43ms</text><text x="44" y="583" font-size="19" fill="#14243c" font-weight="700">effort: low</text><rect x="248" y="562" width="370.62456887215376" height="29" rx="3" fill="#087f73"/><text x="630.6245688721538" y="584" font-size="17" fill="#087f73" font-weight="700">51.48ms</text><text x="248" y="616" font-size="12" fill="#60708a" font-weight="400">0</text><text x="944" y="616" font-size="12" fill="#60708a" font-weight="400">100 ms</text><text x="36" y="671" font-size="17" fill="#14243c" font-weight="700">Tail latency: 406.30 → 198.32 ms P95 (2.05× ratio).</text><text x="36" y="701" font-size="16" fill="#60708a" font-weight="400">High: prioritize decision quality. Low: spend less compute where latency matters.</text><text x="36" y="734" font-size="13" fill="#60708a" font-weight="400">Same 4B-5949 checkpoint · RTX PRO 6000 · historical single-request native forward, one timed pass.</text><text x="36" y="757" font-size="13" fill="#60708a" font-weight="400">80 fixed records / 79 parent groups · selectable budget, not automatic routing · not vLLM HTTP performance.</text></g></svg> |