
Datasets:


license: mit
task_categories:
  - tabular-classification
  - tabular-regression
language:
  - en
tags:
  - delivery
  - logistics
  - EDA
  - zomato
  - india
  - food-delivery
size_categories:
  - 10K<n<100K
configs:
  - config_name: default
    data_files:
      - split: train
        path: zomato_cleaned.csv
📹 Video walkthrough:
Zomato Delivery Operations — EDA & Dataset
Dataset Overview
Real-world delivery data from Zomato operations across multiple Indian cities, covering courier attributes, weather conditions, traffic density, GPS coordinates, and delivery outcomes.
| Source | Kaggle — saurabhbadole/zomato-delivery-operations-analytics-dataset |
| Original size | 45,584 rows × 20 columns |
| Final size | 38,964 rows × 22 columns |
| Target variable | Time_taken (min) |
| Domain | Food delivery logistics, India |
Dataset Columns
Numeric: Time_taken (min) · distance_km · Delivery_person_Age · Delivery_person_Ratings · multiple_deliveries · Vehicle_condition · Restaurant_latitude · Restaurant_longitude · Delivery_location_latitude · Delivery_location_longitude
Categorical: Weather_conditions · Road_traffic_density · Type_of_order · Type_of_vehicle · Festival · City · ID · Delivery_person_ID · Order_Date · Time_Orderd · Time_Order_picked
Engineered: distance_km · delivery_speed
"Beyond the obvious - does bad weather always delay deliveries, or do traffic and courier experience change the equation?"
Research Questions
Research Question 1 - Weather vs Traffic
Does extreme weather (storms, fog) always slow deliveries, or does it sometimes clear the roads - actually leading to faster outcomes?
Research Question 2 - The Experience Buffer
Do higher-rated couriers take less time to deliver?
Research Question 3 - Distance vs Operations
Using the Haversine Distance, is a delay just because the customer is far away, or are operational factors the real bottleneck?
Data Preparation
Cleaning Steps
- Dropped rows missing critical columns:
Weather_conditions,Road_traffic_density,multiple_deliveries - Removed duplicate rows (0 found)
- Converted
Time_taken (min)to integer - Stripped whitespace from all categorical columns
- Removed 3,410 rows with corrupted GPS coordinates (lat/lon = 0,0)
- Removed 272 rows with physically impossible distances (>25km, above 99th percentile)
Engineered Features
| Column | Description |
|---|---|
distance_km |
Haversine straight-line distance between restaurant and customer |
delivery_speed |
Categorical bin: Fast (<19 min) / Average (19–33 min) / Slow (>33 min) |
Thresholds for delivery_speed were chosen using the 25th and 75th percentiles
of Time_taken (min) to ensure a balanced split (26.2% / 51.2% / 22.6%).
Intentional Missing Values
Delivery_person_Age (1,019 missing) and Delivery_person_Ratings (1,055 missing)
were kept intentionally. These rows still contribute to Research Questions 1 and 3,
and pandas skips NaN automatically during plotting for Research Question 2.
Outlier Detection

Box plots for the three main numeric columns:
- Delivery Time - no outliers detected (range 10–54 min, all within IQR bounds)
- Distance - no outliers (already filtered to ≤25km)
- Courier Ratings -1,024 values below 3.9 flagged as statistical outliers, kept intentionally as they represent real low-rated couriers central to Research Question 2
Data Validation
This validation step runs after all cleaning and feature engineering are complete - not as part of the EDA itself, but as a final quality gate before any analysis begins.
All categorical columns passed validation with no unrecognized values or stray numeric entries. All numeric columns fell within their expected ranges.
Key Findings
Research Question 1 - Weather vs Traffic
Part A - Weather Condition vs Delivery Time
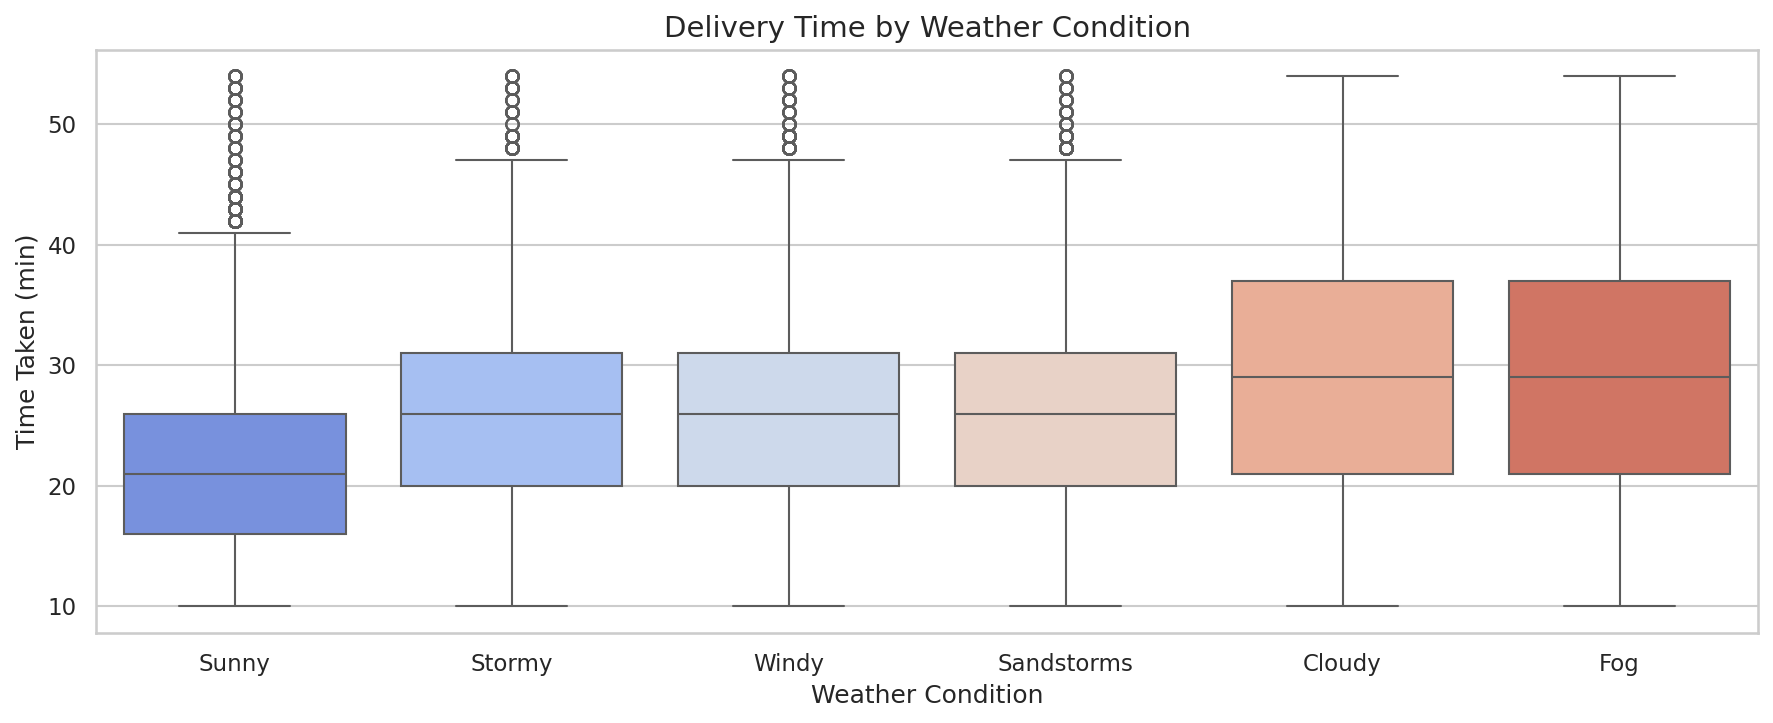
Sunny weather is clearly the fastest (median 21 min), but surprisingly, Stormy and Sandstorms perform no worse than Windy conditions (all at 26 min). Fog and Cloudy are the slowest at 29 min. This challenges the assumption that extreme weather always causes the worst delays.
Part B - Traffic Density vs Delivery Time
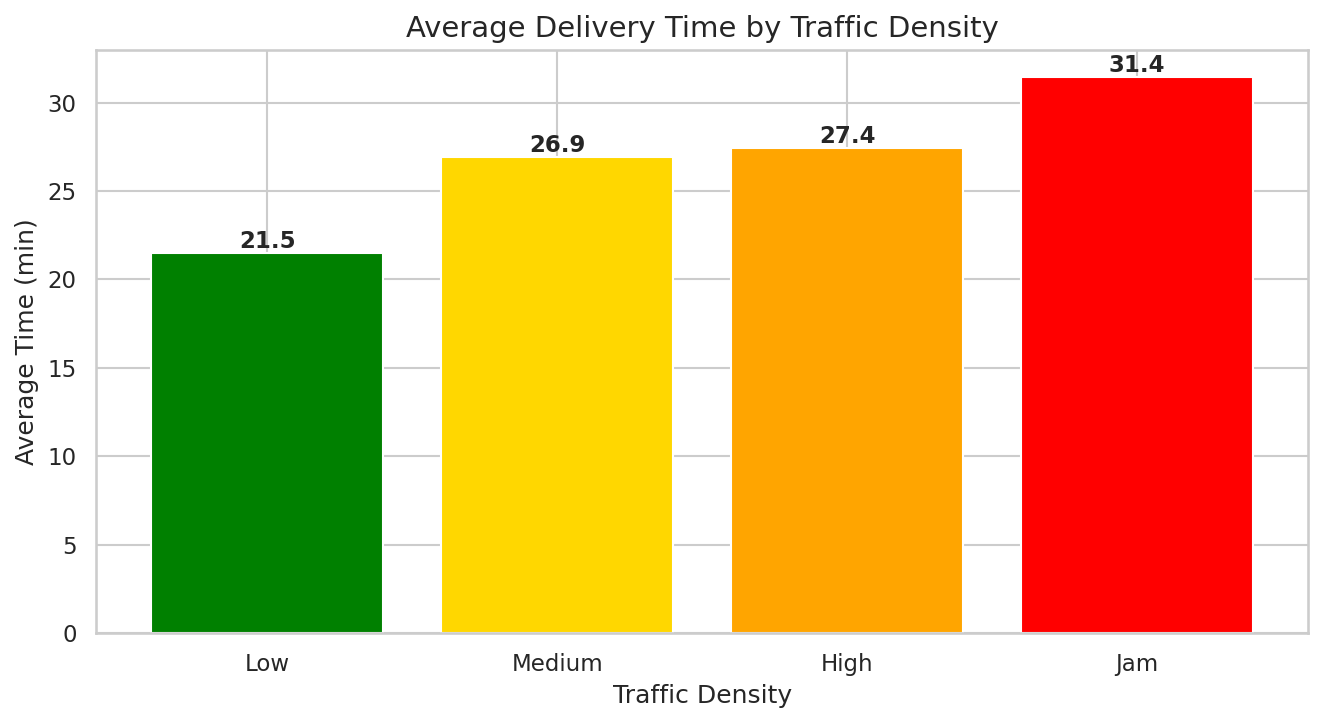
Traffic density has a clear but non-linear effect. The jump from Low (21.5 min) to Medium (26.9 min) is significant, but Medium to High is nearly identical (27.4 min). Only Jam conditions create a meaningful additional delay (31.4 min).
Part C - Weather × Traffic Interaction

The interaction between weather and traffic reveals a surprising pattern. Sunny weather buffers even heavy traffic - Sunny + Jam (23.5 min) is only slightly slower than Cloudy + Low traffic (22.4 min), despite the much heavier traffic conditions. Fog and Cloudy conditions combined with Jam are the worst combination (36.8–36.9 min), while Stormy and Sandstorms perform significantly better than expected under heavy traffic.
Research Question 2 - The Experience Buffer
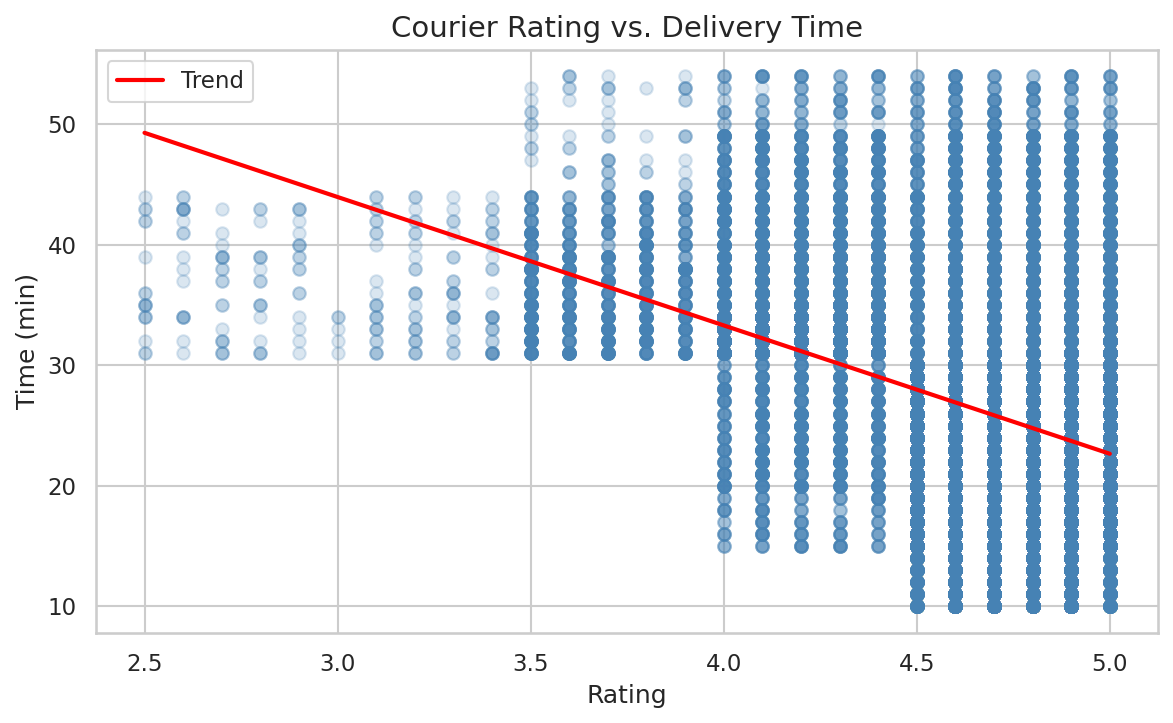
Courier rating (r = -0.362) is a strong predictor of delivery time - A highly-rated courier consistently delivers faster.
Note: these are correlational findings, not causal.
Research Question 3 - Distance vs Operations

Distance matters, but it's not the real bottleneck. Multiple deliveries per trip (r = 0.384) is a stronger predictor than distance (r = 0.322). A courier handling 3 deliveries per trip averages 47.8 min - more than double the 23.1 min average for single-stop deliveries.
Plots
Bonus 1 - Distribution of Delivery Times

Most deliveries fall between 19–33 min, with the peak at the Average category. There are 2 distinct peaks - one around 19–20 min and one around 26–28 min - suggesting 2 types of deliveries: Fast (likely 1 stop or low traffic) and Average (more stops or heavier traffic).
Bonus 2 - Correlation Matrix
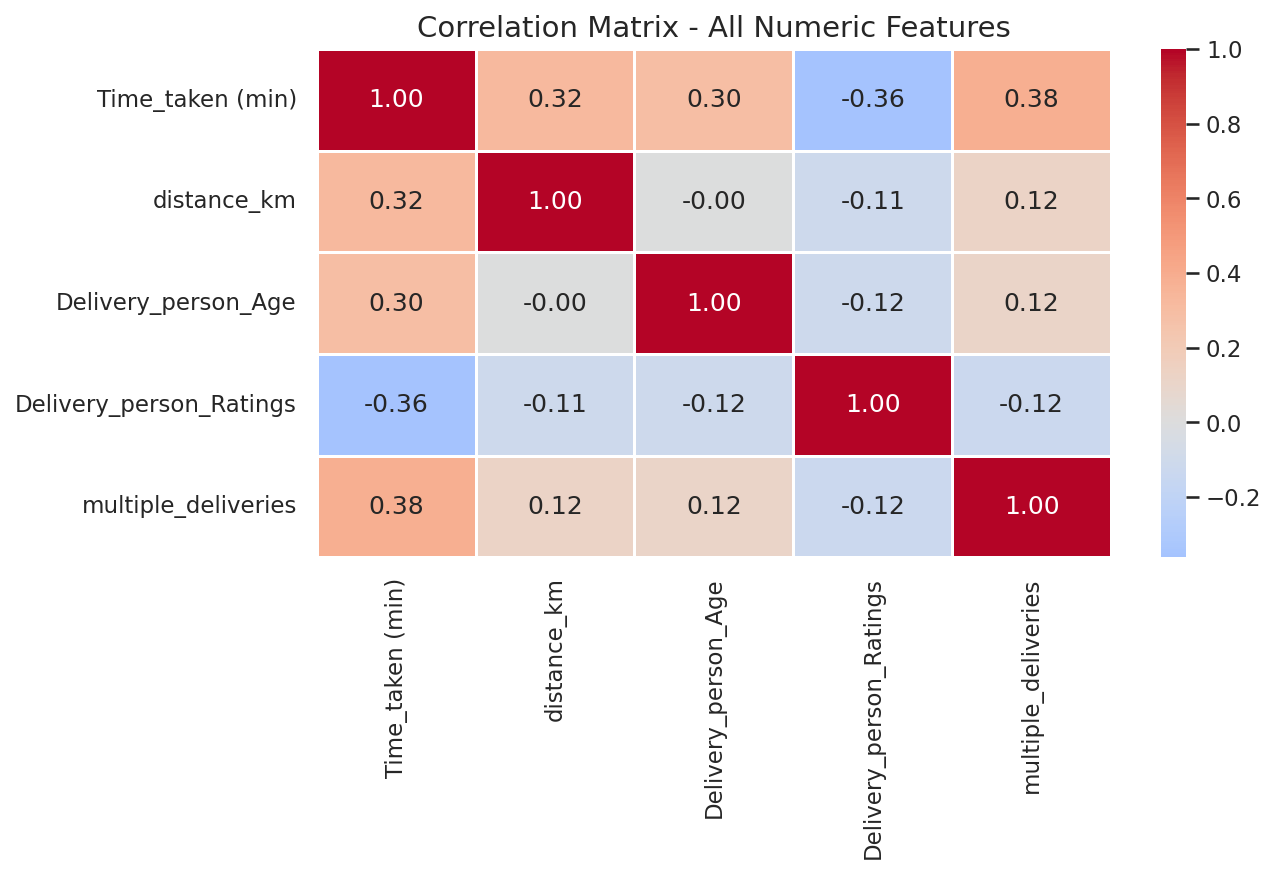
The strongest correlation with delivery time is multiple_deliveries (0.38),
followed by courier rating (-0.36), and surprisingly distance_km is only in
third place (0.32). Notably, Delivery_person_Age and distance_km show 0
correlation — meaning courier age has no relation to how far they travel.
Correlation Summary
| Feature | Correlation with Time_taken |
|---|---|
multiple_deliveries |
+0.384 |
Delivery_person_Ratings |
−0.360 |
distance_km |
+0.322 |
Delivery_person_Age |
+0.298 |
Challenges & Reflections
1. The Challenge of Iterative Data Cleaning: One of the main challenges in this project was realizing that data preparation is not a one-time linear step. After conducting the initial Exploratory Data Analysis (EDA), I had to implement a second, targeted data cleaning phase before diving into the final analysis.
- The Rationale: The EDA visualizations and distance calculations (
Haversine) exposed deeper, hidden anomalies that weren't immediately obvious—such as corrupted GPS coordinates (0,0) and unrealistic delivery distances (e.g., >25 km). - Strategic Missing Data Handling: Furthermore, I faced a dilemma with missing data. Instead of blindly dropping all rows with null values (such as missing courier ratings), I selectively retained rows where weather and traffic data were intact. This prevented unnecessary data loss, as those rows were still critical for answering my other research questions.
2. Reflections & Lessons Learned:
- Data over Intuition: My initial hypothesis was that physical distance and severe weather (like storms or heavy rain) would be the ultimate bottlenecks for delivery times. However, the data told a different story.
- The Real Bottlenecks: The analysis proved that logistical decisions—specifically
multiple_deliveries—and Courier Ratings have a much stronger impact on delivery delays than straight-line distance. Surprisingly, sunny weather combined with heavy traffic was often a larger hurdle than a storm. - Key Takeaway: Always let the data validate the hypothesis. Feature engineering and iterative cleaning were critical in stripping away assumptions and uncovering the actual operational realities of the delivery network.
Final Conclusion
Bad weather alone does not reliably delay deliveries. Traffic conditions and courier quality change the equation entirely - a highly-rated courier in sunny weather with a full traffic jam arrives almost as fast as a low-rated courier in clear conditions. The real bottleneck is operational: how many orders are stacked per trip, and who is delivering them.
Column Reference
| Column | Type | Description |
|---|---|---|
ID |
string | Unique order ID |
Delivery_person_ID |
string | Courier ID |
Delivery_person_Age |
int | Courier age |
Delivery_person_Ratings |
float | Courier rating (1–5) |
Restaurant_latitude |
float | Restaurant GPS latitude |
Restaurant_longitude |
float | Restaurant GPS longitude |
Delivery_location_latitude |
float | Customer GPS latitude |
Delivery_location_longitude |
float | Customer GPS longitude |
Order_Date |
string | Date of order |
Time_Orderd |
string | Time order was placed |
Time_Order_picked |
string | Time order was picked up |
Weather_conditions |
string | Sunny / Cloudy / Fog / Stormy / Windy / Sandstorms |
Road_traffic_density |
string | Low / Medium / High / Jam |
Vehicle_condition |
int | Vehicle condition (0–2) |
Type_of_order |
string | Snack / Meal / Drinks / Buffet |
Type_of_vehicle |
string | motorcycle / scooter / electric_scooter |
multiple_deliveries |
int | Number of additional stops in the trip (0–3) |
Festival |
string | Yes / No — whether a festival was active |
City |
string | Metropolitian / Urban / Semi-Urban |
Time_taken (min) |
int | Target — total delivery time in minutes |
distance_km |
float | Engineered — Haversine distance in km |
delivery_speed |
category | Engineered — Fast / Average / Slow |
Notebook
The full analysis notebook (.ipynb) is included in this repository.
It covers the complete pipeline: data loading, cleaning, feature engineering,
validation, outlier detection, descriptive statistics, and all visualizations.