

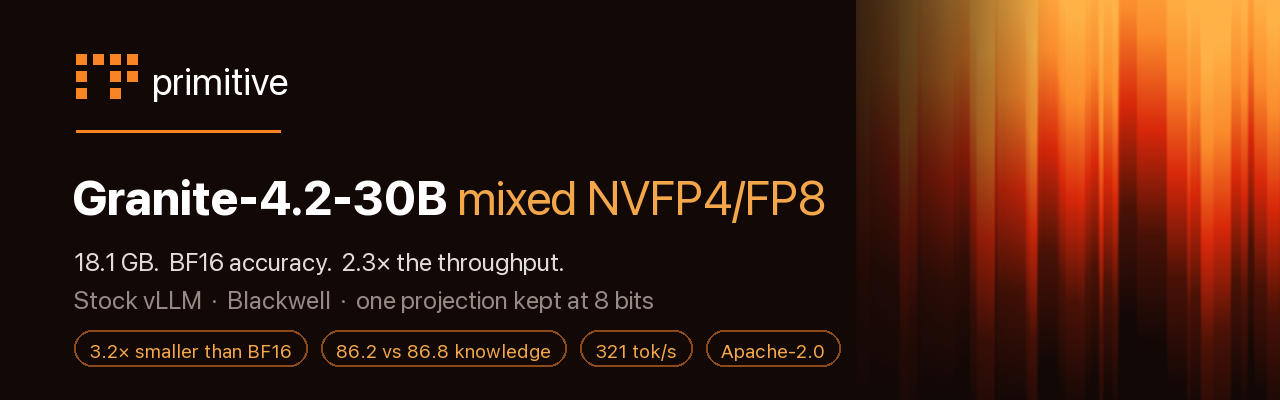






A third of the size, level with BF16. One projection kept at 8 bits.
Mixed-precision quantization of ibm-granite/granite-4.2-30b to
18.1 GB, 3.2× smaller than BF16, on stock vLLM.
The MLP and the fused q/k/v are NVFP4; o_proj is FP8.
Why this quant
- 🗜️ 3.2× smaller than BF16, 40% smaller than IBM's FP8. 18.1 GB against 58.6 GB and 30.1 GB.
- 🎯 Knowledge ties BF16. 86.2 against 86.8 over 1,170 items and six runs (Welch t = −1.79). The uniform NVFP4 build of the same weights scores 85.3, which is 1.4 below BF16 and outside the noise (t = −5.76).
- 🧭 The difference is one projection.
o_projis 40% of attention's parameters and carries about 72% of what moving attention off 4 bits recovers. Protecting it costs 0.47 GB; protecting all of attention costs 1.18 GB and buys 0.18 points more. - ⚡ 2.3× BF16 throughput at concurrency 32, 2.6× single-stream. 321 tok/s against 139, and 58.3 against 22.2.
- 💸 The mixed layout costs no kernel time. Every build measured moves its weights at 1178–1192 GB/s. This one carries 2.7% more bytes than the uniform build and returns 2.7% fewer tokens per second, which is the whole of the difference.
- ⚠️ If you have 30 GB, IBM's own FP8 is the more accurate build. 8-bit is lossless on this model by our measurement (87.3 against BF16's 86.8, t = 1.12). This one exists for the 18 GB slot.
- 🔧 Stock vLLM,
compressed-tensors, no patches. Round-to-nearest weights; calibration is used only to observe the NVFP4 activation scales.
Serve it
vllm serve primitive-ai/granite-4.2-30b-mixed-NVFP4-FP8 --max-model-len 20480
Thinking is on by default in Granite's own template. chat_template_kwargs
{"enable_thinking": false} turns it off; {"reasoning_effort": "low"} shortens it.
Measured
1,370 items across fourteen public benchmarks. A 1,170-item knowledge suite and a 200-item
tool-calling suite, under one fixed protocol for every row: temperature 0.6 / top_p 0.95 /
top_k 20, thinking forced on, a 16,384-token budget, concurrency 32, all rows back to back in one
sitting on one RTX PRO 6000 Blackwell.
| build | size | overall | knowledge | call | abstain | runs k/a | finished | out/answer | tok/s @ 32 | per-token latency | tok/s @ 1 |
|---|---|---|---|---|---|---|---|---|---|---|---|
| IBM BF16 | 58.6 G | 86.0 | 86.8 | 86.7 | 60.8 | 3/3 | 98.8% | 1370 | 139 | 95.2 ms | 22.2 |
| IBM FP8 | 30.1 G | 86.4 | 87.3 | 86.7 | 60.0 | 3/3 | 98.9% | 1366 | 234 | 95.5 ms | 38.6 |
| this repo | 18.1 G | 85.5 | 86.2 | 85.8 | 60.8 | 6/6 | 98.5% | 1502 | 321 | 86.3 ms | 58.3 |
| IBM NVFP4 | 17.7 G | 84.6 | 85.3 | 86.7 | 58.3 | 4/3 | 98.8% | 1420 | 334 | 83.7 ms | 60.2 |
| all attention at FP8, built and not shipped | 18.8 G | 85.6 | 86.4 | 84.6 | 61.7 | 3/6 | 98.6% | 1427 | 316 | 87.6 ms | 56.2 |
overall is one number over both suites: the 1,170 knowledge and 200 tool-calling items pooled
as 1,370, weighted 85.4% and 14.6% by item count.
Where the tool-calling half goes: call vs abstain
| build | agentic | call | abstain |
|---|---|---|---|
| IBM BF16 | 81.5 | 86.7 | 60.8 |
| IBM FP8 | 81.3 | 86.7 | 60.0 |
| this repo | 80.8 | 85.8 | 60.8 |
| IBM NVFP4 | 81.0 | 86.7 | 58.3 |
call is accuracy on the 160 rows that require a call; abstain is the 40 whose correct action is
to call nothing. Benchmarks: BFCL v4 (30, including irrelevance), xLAM/APIGen (45), ToolACE
(45), Glaive v2 (40), nvidia When2Call (40, the abstention rows). Tool schemas go in the system prompt
and the model answers with a JSON array of calls, the same way for every model. An item counts only
if every expected call is present with acceptable arguments and no call is invented.
Nothing separates this field on tool calling. Every build lands in 80.8–81.5 and the suite's own run-to-run spread is wider than the gaps. Quantization did not cost this model its tool use.
Read the runs column, and read this before reading any gap. Three consecutive knowledge runs
of this checkpoint scored 86.50, 86.15 and 86.15, which suggests a run-to-run sd near 0.2. Six
runs on weights proven byte-identical span 85.60 to 87.26, sd 0.61. The tight triple was luck,
and an earlier draft of this card quoted a t-statistic off it that was inflated about twofold.
Treat anything under about 1.2 points on this suite as unresolved until both sides have six
runs. The throughput columns come from one sitting and drift a few percent between sittings, so read
them as a bracket.
On the last row. Putting all four attention projections at FP8 rather than o_proj alone scores
86.4 on knowledge for 0.71 GB more and 3.5% less decode speed. It was built, gated and measured on
the same protocol; it is not published because the pooled difference (85.6 against 85.5) is inside
the noise described above and it is the larger, slower artifact.
GPTQ over this allocation is a null. Calibrated weight updates measured +0.49 after one run, +0.31 after two and +0.26 after three (t = 0.80), at identical size and identical bytes per decode step. The weights here are the calibrated ones because those were the ones staged and verified, but the calibration is not why the build scores what it does.
Comparable with our other models
Accuracy numbers move for reasons that have nothing to do with the model: a shorter token budget, a
different temperature, or whether the model was allowed to reason at all. So every number in this
table, on this card and on our other cards, comes from one fixed protocol.
The same 1,370 items: a 1,170-item knowledge suite (MMLU-Pro, ARC-Challenge, HellaSwag, WinoGrande,
CommonsenseQA, BoolQ, OpenBookQA, GSM8K, MATH-500) and a 200-item tool-calling suite (BFCL v4,
xLAM/APIGen, ToolACE, Glaive v2, nvidia When2Call). temperature 0.6, top_p 0.95, top_k 20,
thinking forced on, a 16,384-token budget, no reasoning parser, scoring the last ANSWER: in the
reply. Concurrency 32 on one RTX PRO 6000 Blackwell, each model's rows in one sitting. Auto-scored,
no LLM judge. Both halves are means of at least three runs per build.
| model | shape | size | overall | knowledge | call | abstain | finished | out | tok/s @ 32 |
|---|---|---|---|---|---|---|---|---|---|
| Laguna-XS-2.1 | 31 B MoE | 19.3 GiB | 81.7 | 83.8 | 68.4 | 73.5 | 98.9% | 1097 tok | 1523 |
| Nemotron-3.5-Lightning-30B-A3B | 30 B MoE+Mamba | 19.2 GiB | 87.1 | 87.9 | 85.4 | 70.5 | 97.9% | 1429 tok | 2204 |
| Ornith-1.5-35B-A3B | 35 B MoE | 22.6 GiB | 88.7 | 91.7 | 74.4 | 60.0 | 99.3% | 760 tok | 1469 |
| Muse-Glimmer-30B | 30 B MoE | 20.4 GiB | 86.6 | 88.8 | 78.6 | 54.5 | 99.7% | 800 tok | 1176 |
| Qwen3.8-27B | 27 B dense | 20.7 GiB | 88.8 | 90.4 | 85.5 | 54.5 | 99.7% | 651 tok | 908 |
| Granite-4.2-30B (this repo) | 30 B dense | 18.1 GB | 85.5 | 86.2 | 85.8 | 60.8 | 98.5% | 1502 tok | 321 |
| Laguna-S-2.1 | 110 B MoE | 64.0 GiB | 84.3 | 87.1 | 64.6 | 81.0 | 97.3% | 995 tok | 670 |
| Qwen3.8-Flash-Next | 180 B MoE (6 B active) | 183.7 GB | 90.3 | 92.2 | 84.8 | 56.7 | 99.5% | 686 tok | 816 |
Read overall with finished. overall scores an answer that overran the token budget as wrong,
but it cannot say whether the model needed the room or failed to stop; finished and out separate
those. A gap under 1.0 is a tie. The tok/s column comes from each model's own sitting and drifts
a few percent between sittings, so read it as a bracket.
The tok/s column is not comparable across shapes. Granite-4.2-30B is dense: every one of its
30 B parameters is read for every token. The MoE rows above it read a fraction of theirs, which is
why a 180 B model outruns this one. Compare within a shape, or compare against the same model's
other builds.
call and abstain are the tool-calling suite's two halves, reported separately. call is
accuracy on the 160 items that require a tool call; abstain is the 40 whose correct action is to
call nothing. They used to be pooled into one agentic number, and the pooling misled: a model with
ordinary call accuracy and unusual abstention discipline outscored models that are better at
actually making calls. Weight them by your own workload's mix.
Per-benchmark detail, both halves
| benchmark | Laguna-XS-2.1 | Nemotron-3.5-Lightning-30B-A3B | Ornith-1.5-35B-A3B | Muse-Glimmer-30B | Qwen3.8-27B | Granite-4.2-30B | Laguna-S-2.1 | Qwen3.8-Flash-Next |
|---|---|---|---|---|---|---|---|---|
| knowledge | ||||||||
| mmlu_pro | 79.0 | 82.0 | 89.5 | 89.0 | 89.5 | 79.4 | 81.0 | 89.0 |
| math_500 | 76.0 | 80.0 | 88.0 | 74.0 | 82.0 | 80.0 | 83.0 | 86.0 |
| gsm8k | 97.0 | 96.0 | 99.0 | 98.0 | 98.0 | 96.3 | 99.0 | 97.0 |
| arc_challenge | 94.0 | 97.3 | 98.7 | 98.0 | 98.0 | 95.9 | 96.0 | 98.7 |
| hellaswag | 70.7 | 78.0 | 86.7 | 83.3 | 82.0 | 76.7 | 76.7 | 88.7 |
| winogrande | 84.7 | 89.3 | 89.3 | 90.7 | 89.3 | 85.1 | 86.0 | 95.3 |
| commonsenseqa | 80.8 | 83.3 | 86.7 | 82.5 | 84.2 | 83.6 | 85.8 | 86.7 |
| boolq | 90.0 | 92.0 | 92.0 | 90.0 | 91.0 | 90.2 | 92.0 | 94.0 |
| openbookqa | 94.0 | 99.0 | 98.0 | 97.0 | 97.0 | 96.7 | 94.0 | 96.0 |
| tool calling | ||||||||
| bfcl_v4 | 83.3 | 96.7 | 76.7 | 86.7 | 96.7 | 95.6 | 90.0 | 96.7 |
| xlam | 64.4 | 73.3 | 55.6 | 66.7 | 77.8 | 75.9 | 48.9 | 82.2 |
| toolace | 37.8 | 71.1 | 71.1 | 64.4 | 68.9 | 78.5 | 48.9 | 73.3 |
| glaive | 87.5 | 97.5 | 92.5 | 100.0 | 100.0 | 97.9 | 85.0 | 100.0 |
| when2call | 75.0 | 77.5 | 52.5 | 55.0 | 55.0 | 60.8 | 75.0 | 55.0 |
What's quantized to what
Granite-4.2-30B is dense, so nothing is sparsely active and the usual reasoning about protecting an
always-active path has nothing to say. What does say something is where the weights sit: the MLP is
25.77 B parameters (90.6%), attention 2.68 B (9.4%), and the untied embeddings and head
0.82 B (2.8%). Going to 4 bits is a decision about the MLP, which leaves attention cheap to
treat differently. q, k and v are fused into one tensor by the engine and must share a scheme;
o_proj is its own module and does not.
| tensors | format |
|---|---|
all 64 layers' mlp.gate_proj / up_proj / down_proj; self_attn.q_proj / k_proj / v_proj |
NVFP4 (group 16) |
self_attn.o_proj |
FP8 E4M3 (channel weights, dynamic per-token activations) |
lm_head, embed_tokens, norms |
BF16 |
compressed-tensors, top-level format mixed-precision, two config groups. NVFP4 is W4A4, so the
activation scale is data: exported data-free, every input_global_scale comes out zero, vLLM
computes 1/0, and the model emits noise while its weights still verify against the source. The
256 UltraChat conversations are there to observe those scales.
IBM's model.sig is deliberately not carried over. It signs the original weights and would not
verify against these.

primitive ·
more models ·
inference economics for production LLM systems
- Downloads last month
- 49
Model tree for primitive-ai/granite-4.2-30b-mixed-NVFP4-FP8
Base model
ibm-granite/granite-4.1-30b-base